
National Energy Production in Comparison
- Jul
- 31
Guest Post by Lizzie Dawes
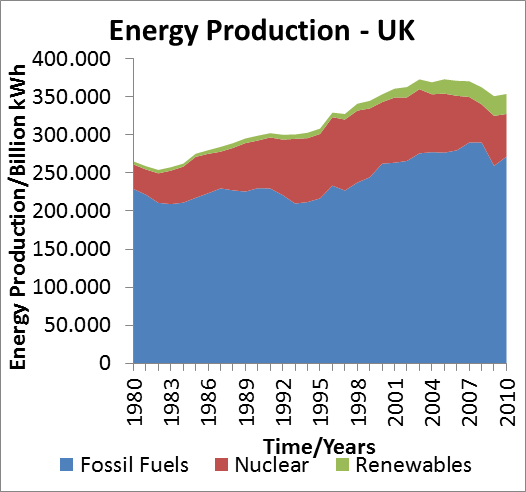
Of the individual countries looked at (Austria, UK, Germany, USA), Austria produces the most renewable energy, in terms of proportion. Unsurprisingly, given its area, the USA produces the most renewable energy. The USA was second only to China in its investment in renewables, spending $51 billion (around 41 billion Euros) in 2011.
 As can be seen from the graphs, Austria produces more hydroelectric power than any other type of power – including conventional thermal power. Why is this? Is it because Austria has ample opportunity for hydroelectric power stations? Is it because Austria’s waterways are not vital for commerce, with Austria being landlocked? Is it because Austrians are more receptive to the idea of renewable energy and are prepared for hydroelectric power stations to be built?
 Perhaps the answer lies in Austria’s geography – Austria is mountainous, to a degree that Britain and Germany are not – 68% of Austria’s land is above 500m. The majority of its hydroelectric power stations are in mountainous regions. Similarly, most of Britain’s hydroelectric power plants lie in mountainous regions – in Scotland and Wales, largely.
 It is not as if other countries lack opportunity for hydroelectric power –Britain has mooted the idea of a barrage on the River Severn for decades, for example. Recently, there have been plans for more plants along the Mississippi River (USA), some of which have been abandoned as the price of natural gas has fallen.
Is hydroelectric the answer, though? Germany has invested heavily in renewable energy – 200 billion Euros have been pledged to build offshore wind farms. Indeed, Germany’s investments appear to have been successful – it now produces nigh on four times the energy from renewable sources as the UK and well over twice as much as Austria.
 It should also be noted that even Austria has not run away with itself building hydroelectric power plants – a protest at the Hainburger Au in 1984 stopped the construction of a hydroelectricity power station there, due to the impact the power station would have had on the environment.
 Austria, as can be seen from the graphs, has never produced any nuclear power, after a referendum in 1978, deciding that the Zwentendorf Nuclear Power Plant was never to be used and since then, Austria has never operated a nuclear power plant. An interesting twist in Zwentendorf’s tale is that it has become, at least for the present, Austria’s largest solar power station.
Another factor to take into consideration is that most renewables (wind, solar, hydroelectric, for example) cannot be used constantly – they depend on the time of day, weather, etc.

It is obvious that there are still issues to be solved, with regard to providing energy, even through renewable sources – careful consideration will still be needed on how to provide power when renewable sources currently cannot – either new ways of generating energy need to be found, or further investment is needed in geothermal, biomass, or nuclear energy.
All graphs based on data from US Energy Information Administration.